SCALED SCORE VS STANDARD SCOREIs a scaled score the same as a standard score?
There is a lot of confusion with the concepts of Scaled score and Standard score, and to understand the difference we need to know how are they made. THE 3 CHARACTERISTICS OF A SCALED SCORE VS A STANDARD SCORE 1) A Standard Score and a Scaled Score are both scores that we obtain from the transformation of another score (normally raw scores). 2) However, a Standard Score will follow a normal distribution, also known as bell curve or Gaussian distribution. 3) On the other hand, a Scaled Score doesn't have to follow a normal distribution. On the picture below we can see a Standard Score vs Scaled Score distributions. The Standard Score distribution follows the shape of a bell. The Scaled Score distribution doesn't have to. On this picture, the Scaled Score distribution follows a random distribution. |
SCALED SCORE TO STANDARD SCORE CALCULATOR
|
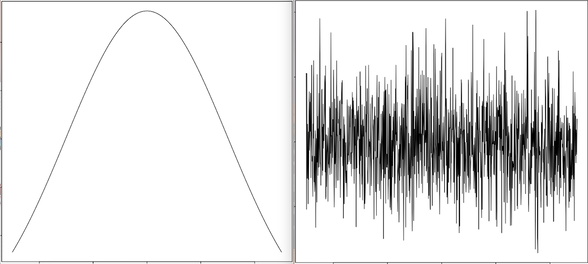
On the left, a graph of aStandard Score distribution. On the right, one of a Scaled Score distribution.
|
|
|
Standard Score Distribution
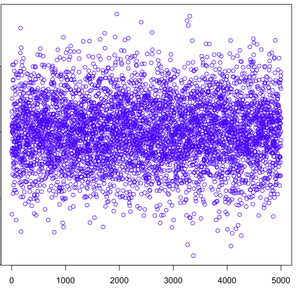
This is how the distribution of a 5000 points of Standard Scores sample would look like
|
|
MORE ABOUT THESE CONCEPTS
A Standard Score is made taking the results of a sample of people, and we are going to get a mean and a standard deviation that will give us as a result a normal distribution, also called bell curve or Gauss bell. To understand this concept we need to think in the example of the IQ (Intelligence Quotient). It is made getting a representative sample of people, we apply a transformation to the results, and we get that a 100 is an average result, it is considered the 'normal' intelligence. 50% of the people will fall above that number, and the other 50% will fall below.
A Scaled Score is a score that we get to be able to compare it better with other scores. This score does not follow a normal distribution, what means that 50% of the people won't necessary fall above or below the mean. You can understand this concept thinking in a test to be admitted to college. 50% of the people won't fail and 50% of the people will pass. It depends on the performance of each individual, and in fact, more people normally pass.
The confusion between Standardized Scores and Scaled Scores can have consequences on their interpretations, for example in the case of education, where teachers might jump into conclusion about the performance of students and why.
In any case, if you want to go deeper, you would probably need to know the difference between a Scaled Score and a Raw Score.
A scaled score is the transformation of a raw score into a new scale. We use this process to make those scores easier to be understood, specially when compared to scores measured using different scales. However, the results of a sample after applying this transformation won't necessary follow a normal distribution.
A raw score is the one that we get direclty with no transformation. It is the score or punctuation that we get directly from a source, and has not suffered any transformation yet. That's why it is called "raw" score, because it is not "cooked" yet. We have to go through a process of transformation to calculate the scaled score. We transform this score to get a scaled score, which will be a number easier to understand and compare.

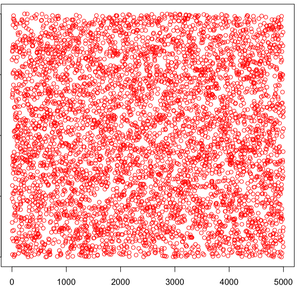
Scaled Score vs Standard Score don't necessarily follow the same distribution.
|
EXAMPLE
Let's say that student A gets a 96 in a given test. And student B, gets a 93 in a different test. If we compare them, we might jump to the conclusion that student A had a better performance. But since we don't know the difficulty of both tests we can't be sure of that. What we do, is to transform both scores into a one new scale that takes into consideration the difficulty of both tests. We get the two raw scores (93 and 96) and we transform them into new standardized ones. We apply certain operations on those numbers and then obtain that student A got a 94 in our new scale, and that student B got a 94 as well. We get then to the conclusion that both students actually had the same level of performance, because if take into consideration both scores and tests difficulty that's what we get. |
|
SCALED SCORE INTERPRETATION
|
|
Finally, this process of scaling is mostly used to calculate and understand test scores. Scaled score interpretation is a process that needs of a context. There are a variety of different important concepts that you should learn and consider to understand and get the interpretation of this process:
- Standard Deviation - Percentile Rank. - Standard Score (SS). There many resources to help you understanding Standard Scores with graphs. - Scaled Score. It is the main topic of this site. - Z Score - T Score. We even have a T-Score to Percentile calculator. - Stanine Some applications of these numbers can be found on, for example, psychometric conversion tables like this one [PDF]. A scaled score interpretation is needed in many different fields. |
AP Statistics Exam
If you are studying for the AP Stats exam you can practice with this AP Stats Test and challenge yourself with the multiple choice questions.